September 27, 2020
Report on the 2020 Asian American Voter Survey
Thoughts About the Election and Current Issues
By Leonard Chan
Curious to learn about what the Asian American electorate is thinking in this election year? You’re just in luck – the 2020 Asian American Voter Survey has just been released.
Back in October of 2008, we featured an article, (Asian Americans and Voting), that reported on the finds of a similar survey called the National Asian American Survey.
We’ll look into some of the changes (if any) in demographics, views, and voting patterns of Asian Americans, since our last article on this subject, using some of the finds from this new survey and some voting statics collected by the Census Bureau.
Before we get to highlighting a few of the questions asked in this survey, here are some things to note –
There were a total of 1,569 registered Asian American voters surveyed.
The survey was conducted from July 15 to September 10, 2020.
There appears to be nearly 100 questions asked, but some of the questions appear to be follow-on questions, so each person was probably not asked all 100 questions.
Because of the size of the survey, we ask that you read it for yourself. There was a lot of information collected by this survey and we’ll only highlight a portion of some of the things we wanted to bring to your attention. To see what the authors of the survey’s found most interesting you can find their video summary here (https://youtu.be/KI4o0DudH1w).
Q1A: There will be a general election for Congress and other offices this November. Are you planning to vote or not planning to vote in that election?
93% of Registered Asian Americans (AA) are planning to vote in the upcoming election. Only 4% said that they were not planning on voting.
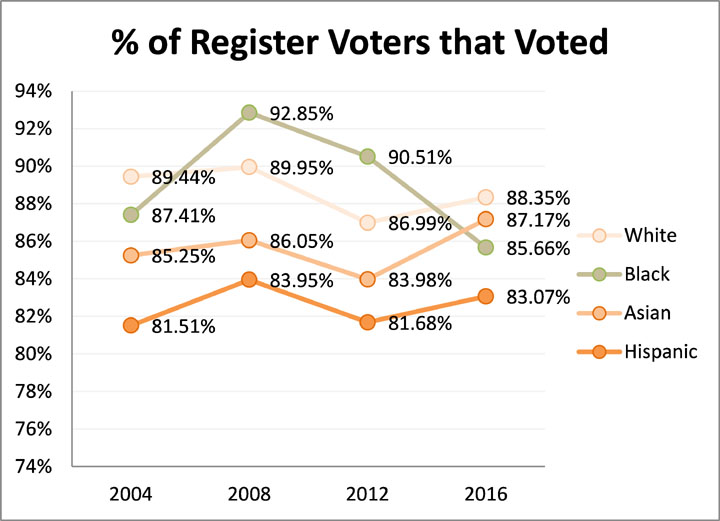
From our research of the Census Bureau’s data of the last four presidential elections, registered AAs voting rates ranged from a low in 2012 of 83.98% to a high in 2016 of 87.17%. If the respondents to the survey are accurately foretelling their plan to vote, then this is likely to be a record high percentage of AA voters that will be taking part in a presidential election.
Q1C: If you do vote in this year's statewide election, will you vote early or by mail using an absentee ballot or will you vote at your precinct polling place on Election Day?
17% of AAs said that they would vote early in person, 54% said that they would vote absentee or by mail, and only 27% said that they plan to vote in person on Election Day.
Q3_1: Discussed politics with family and friends
69% of AAs said yes.
Q3_2: Contributed money to a candidate, political party, or some other campaign organization
As of the period that this survey only 17% of AAs have contributed money to a candidate, political party, or some other campaign organization.
Q3_4: Posted about politics on social media, like Facebook or Twitter
25% of AAs said yes.
Q3_6: Attended a protest march, demonstration, or rally
Q3_7: Attended a meeting of the local school board or Parent Teacher Association
Q3_8: Donated money to a religious organization
Q3_9: Donated money to any other charitable cause
11% of AAs have attended a protest march, demonstration, or rally and 13% have attended a meeting of the local school board or PTA.
35% have donated to a religious organization and 50% have donated to other charitable causes.
Q7D: Compared to previous elections, are you more enthusiastic than usual about voting this year or less enthusiastic?
54% of AAS are more enthusiastic, 28% about the same, and 18% are less.
Q8a: Generally speaking, do you usually think of yourself as a…
44% of AAs think of themselves as Democrats, 23%Republican, 1%other party, 25%Independent, and 7% say no party or unknown.
Note that there are pretty significant differences between the various Asian American groups. This question really highlights the diversity of Asian Americans.

Q9: Thinking about the upcoming November election for President…If the election were being held today would you be inclined to vote for…?
54% of AAs say that they would vote for Biden, 30% for Trump, 1% for some other candidate, and 15% say that they don’t know.
If you view this question’s answer in the “By State Electoral College Rating” section of the survey, it says that of the 286 survey respondents in battleground states 45% favor Biden, 37% favor Trump, 0% for other, and 17% don’t know.
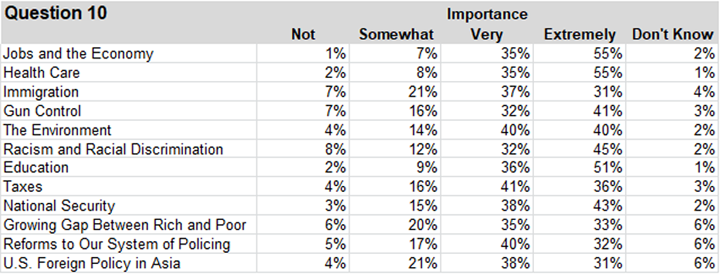
Q10: Now we’d like to ask you about some issues that might be important in the elections in November…
The survey asked the participants about how they felt about a range of issues. They answered by rating how important each issue was to them. Here is a table with their answers.

Q14_1: Local governments should shift spending from law enforcement to programs
32% of AAs agree strongly and 27% agree somewhat
Q14_2: The government should do more to give Blacks equal rights with Whites
42% of AAs agree strongly and 21% agree somewhat
Q14_3: We should have stricter gun laws in the United States
61% of AAs agree strongly and 20% agree somewhat
Q14_5: Undocumented immigrants should have the opportunity to eventually become U.S. citizens
32% of AAs agree strongly and 27% agree somewhat
Q14_6: Congress and the president should pass stronger legislation to reduce the effects of Climate change/global Warming
53% of AAs agree strongly and 24% agree somewhat
Q15B_1: Do you worry about…the health and safety of voting in person or at the polls because of COVID-19?
27% of AAs worry very often, 22% somewhat often, 24% sometimes, and 27% almost never
Q15B_2: Do you worry about…experiencing hate crimes, harassment, and discrimination because of COVID-19?
27% of AAs worry very often, 24% somewhat often, 25% sometimes, and 24% almost never
Q18_6: Please indicate whether you have a favorable or unfavorable opinion of the Black Lives Matter Movement, which seeks racial equality and campaigns against violence and systemic racism toward Black People?
26% of AAs have a very favorable opinion of the movement and 28% somewhat favorable
Q18_7: Please indicate whether you have a favorable or unfavorable opinion of The DREAMER movement, which is a movement to improve immigrant rights led by young undocumented immigrants?
23% of AAs have a very favorable opinion of the movement and 27% somewhat favorable
Besides the answers to the 2020 Asian American Voter Survey we also did some analysis of Census Bureau data on voting patterns of different ethnic groups over the last four presidential elections (2004 to 2016).
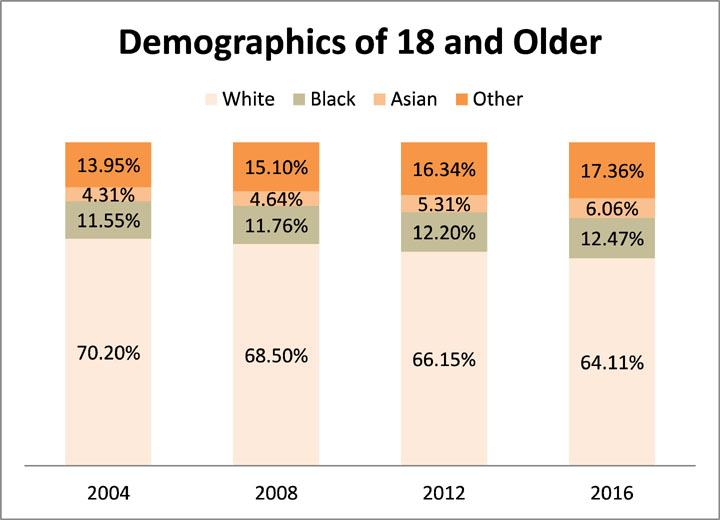
The following graph show that the adult Asian population in America increased from 4.31% to 6.06%. If you include Asians of mixed ethnicity the percentage went from 4.51% to 6.42%.

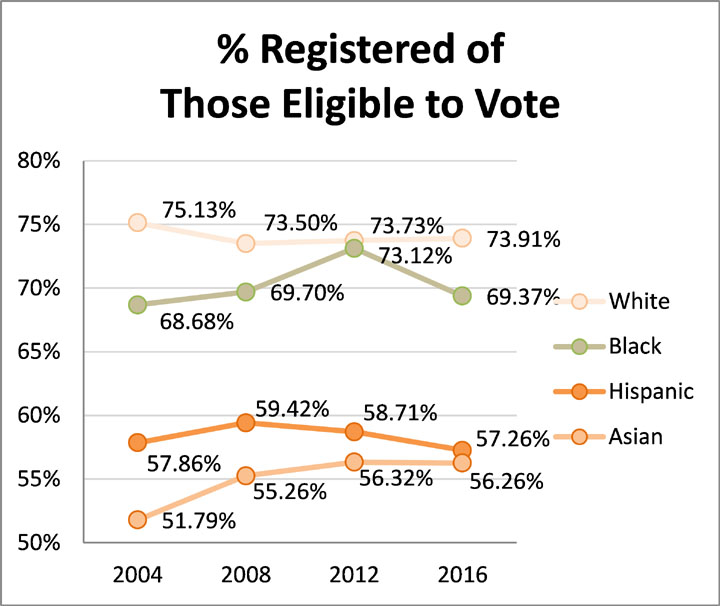
The percentage of Asian Americans that register to vote of those that were eligible to vote went from 51.79% to 56.26%. This percentage is way below the percentage that registered to vote among White and Black Americans (73.91% for Whites and 69.37% for Blacks in 2016).

The percentage of Asian Americans that were registered and voted is very much in line with other ethnicities. Asian Americans nearly match White Americans in 2016 in their percentage that voted (88.35% of Whites voted versus 87.17% of Asian Americans).

Here is an Excel file with the data that we collected from the Census Bureau.
Copyright © 2020 by AACP, Inc.